

AI usage Pro
AI usage shows how much Plane AI your workspace consumes. It gives you a monthly meter, a usage trend over time, and a detailed breakdown of where AI is being used, so you can keep an eye on consumption and stay ahead of your monthly allowance.
Two screens in Plane AI show how much AI your team uses. Usage shows how far through your monthly allowance you are. Analytics shows where the usage went. Both are read-only. For how the limits themselves work, see AI credits.
Open the screens
- Select AI in the app rail.
- In the Plane AI sidebar, select Usage or Analytics.
If the sidebar has no Usage entry, Plane AI or usage reporting is not on for your workspace yet. See Plane AI for how to enable Plane AI.
Personal and Workspace views
You open your own usage. Workspace admins and owners also see two tabs, Personal and Workspace, and can switch between them.
- My usage shows your own usage.
- Workspace usage shows usage across the whole workspace, members and agents together.
On the Usage screen, the tabs appear only when agents are enabled in the workspace. On the Analytics screen, admins and owners always get them.
The Usage screen
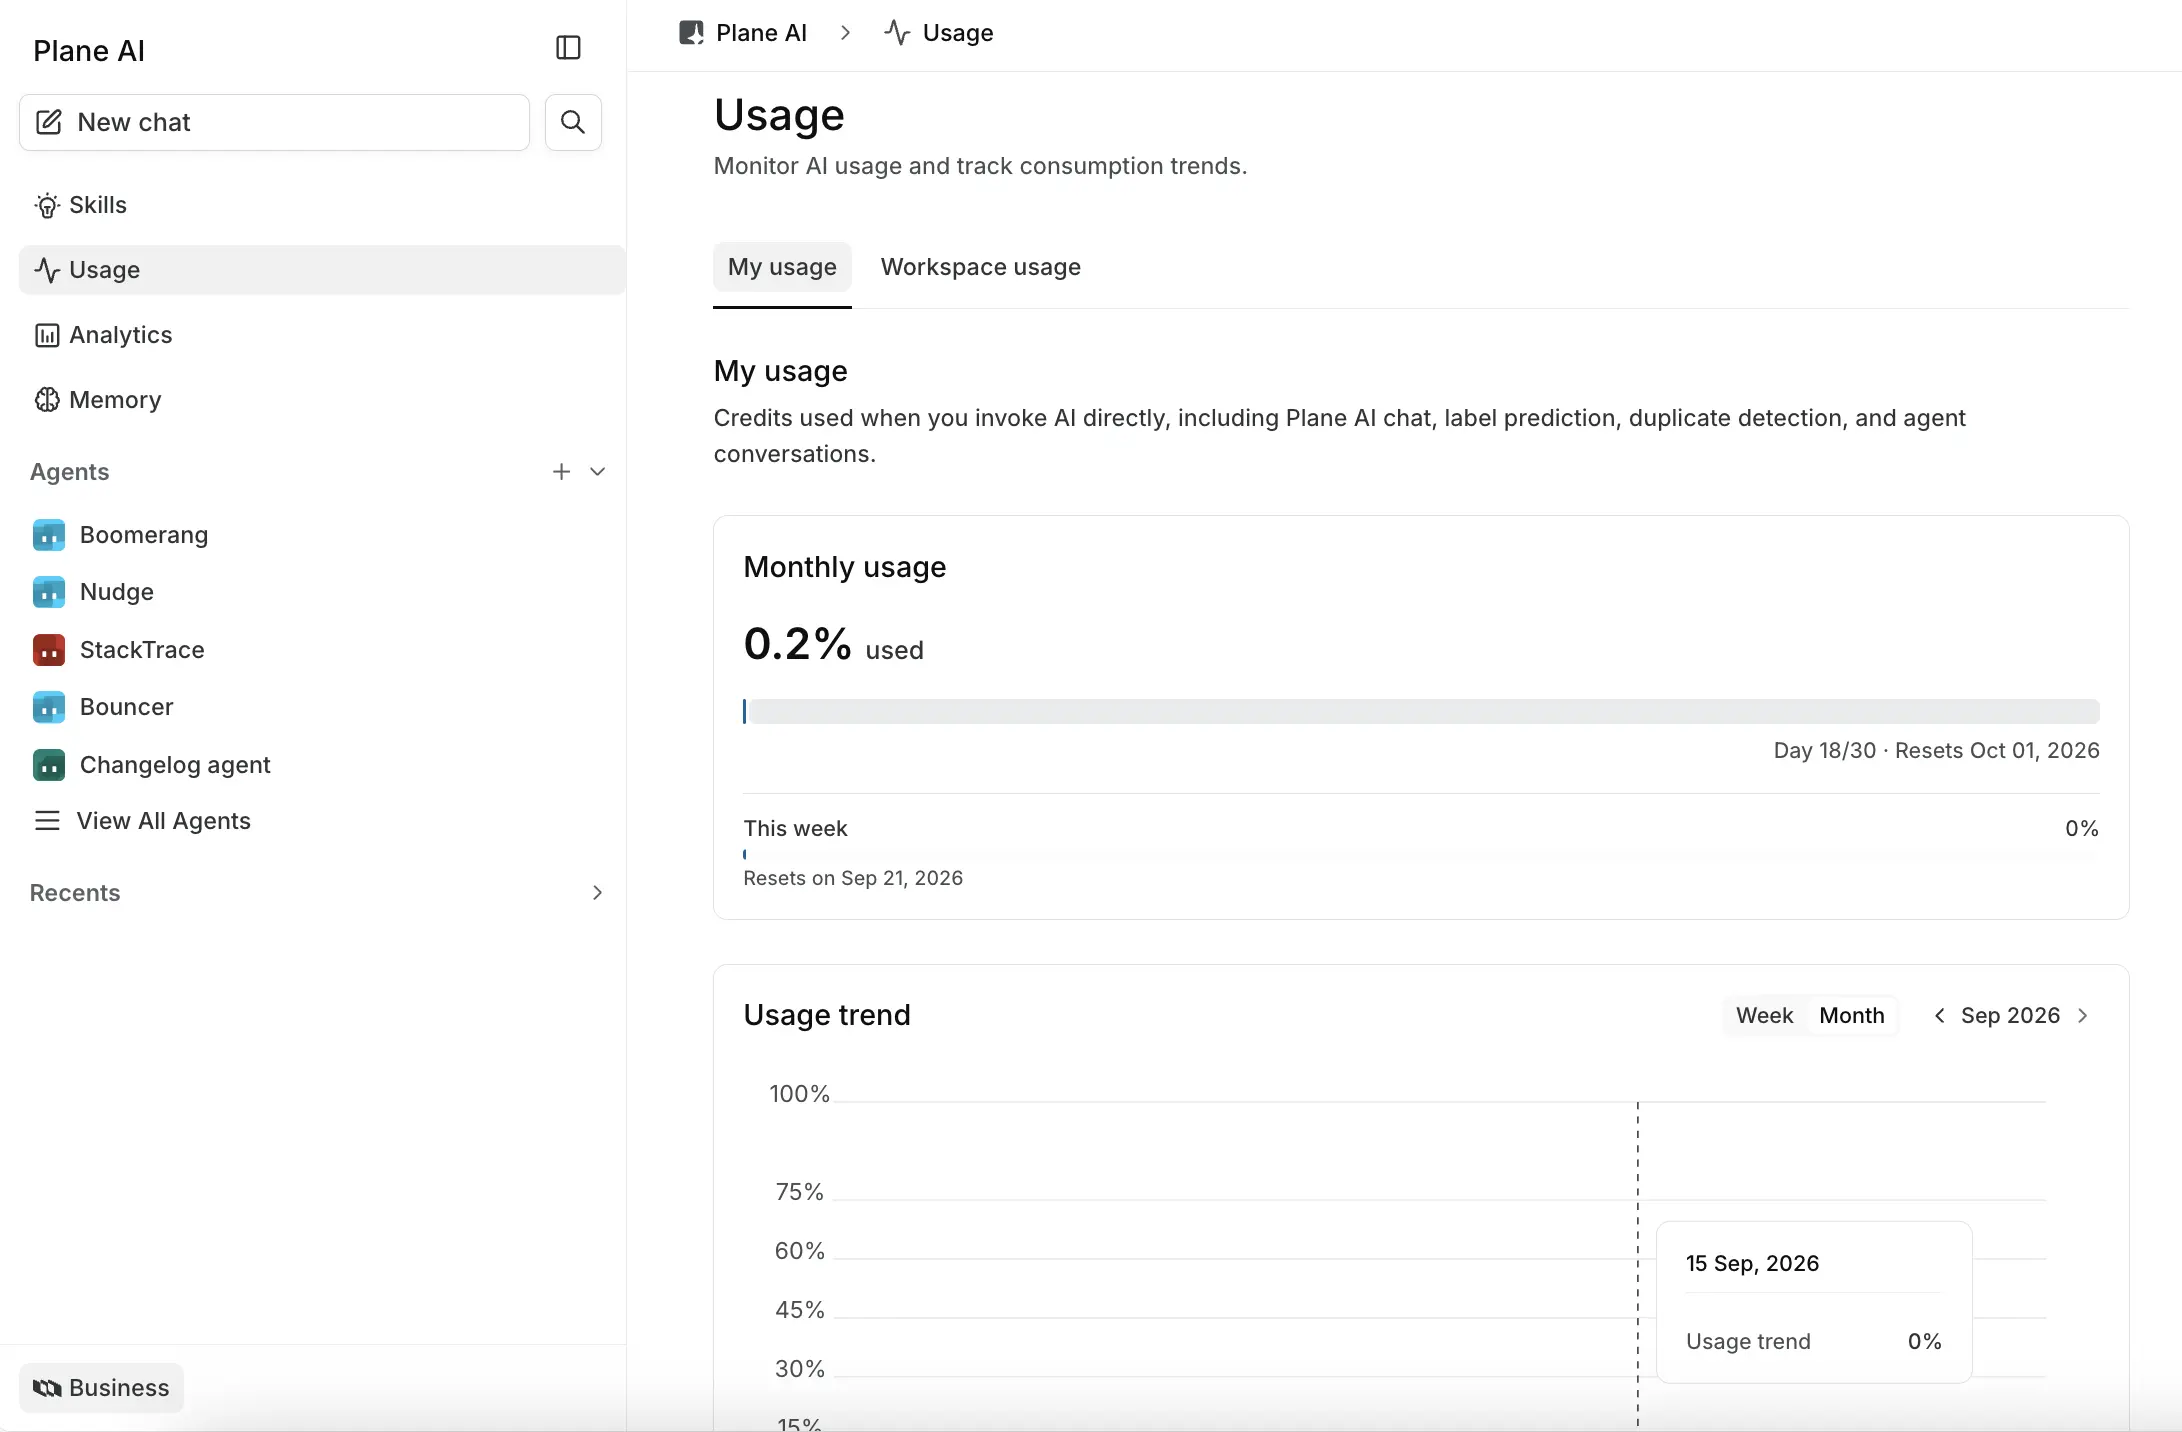
Monthly usage
Shows how much of your included allowance you have used this month, as a percentage with a bar. Under the bar you see where you are in the month and the reset date, for example Day 17/30 · Resets Oct 01, 2026.
This week and Today show the same allowance over shorter windows so you can see the pace. The card always shows the current month, even while you browse earlier months in the chart below.
The card also carries your status:
- Nearing limit appears at 80% usage, signaling you to plan the rest of the month
- Limit reached appears at 100%, meaning AI is paused for you until the reset
The percentage can end above 100%, because a request that starts before the limit is allowed to finish.
Workspace view: The shared workspace pool used by autonomous agent runs, such as agent mentions in comments, work item assignments, and cron schedules.
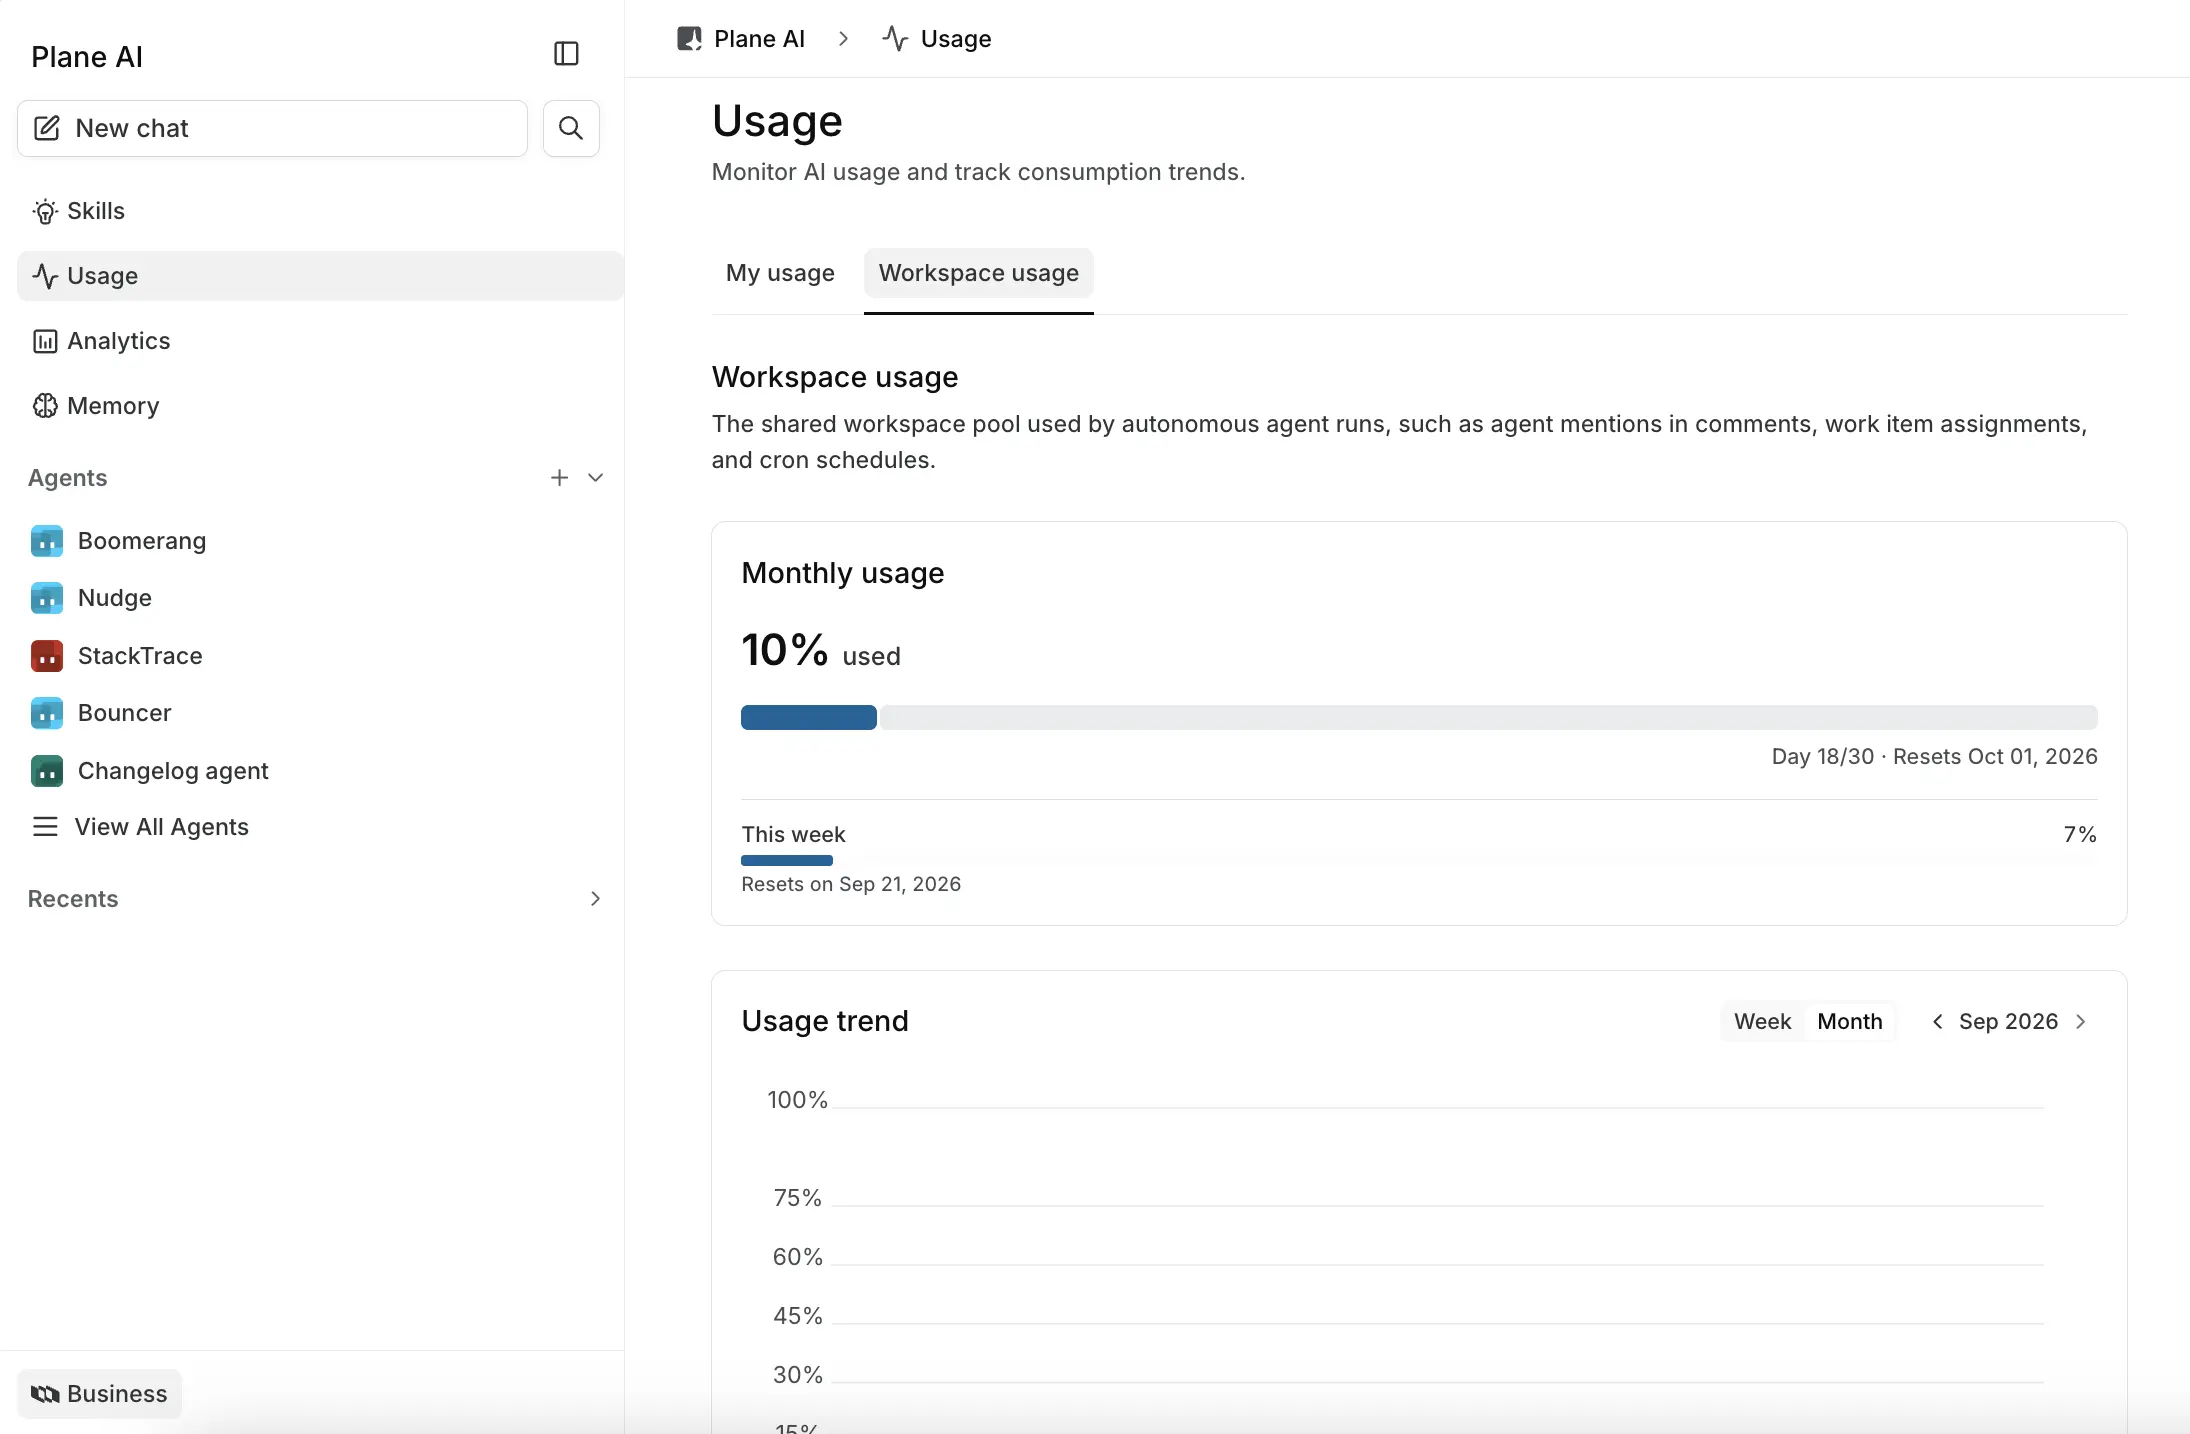
Usage trend
Charts usage over time. Switch between Week and Month, and use the arrows to move to earlier periods. The Week view only changes how the chart groups the data. Your allowance still resets monthly on the first day of each month.
The Analytics screen
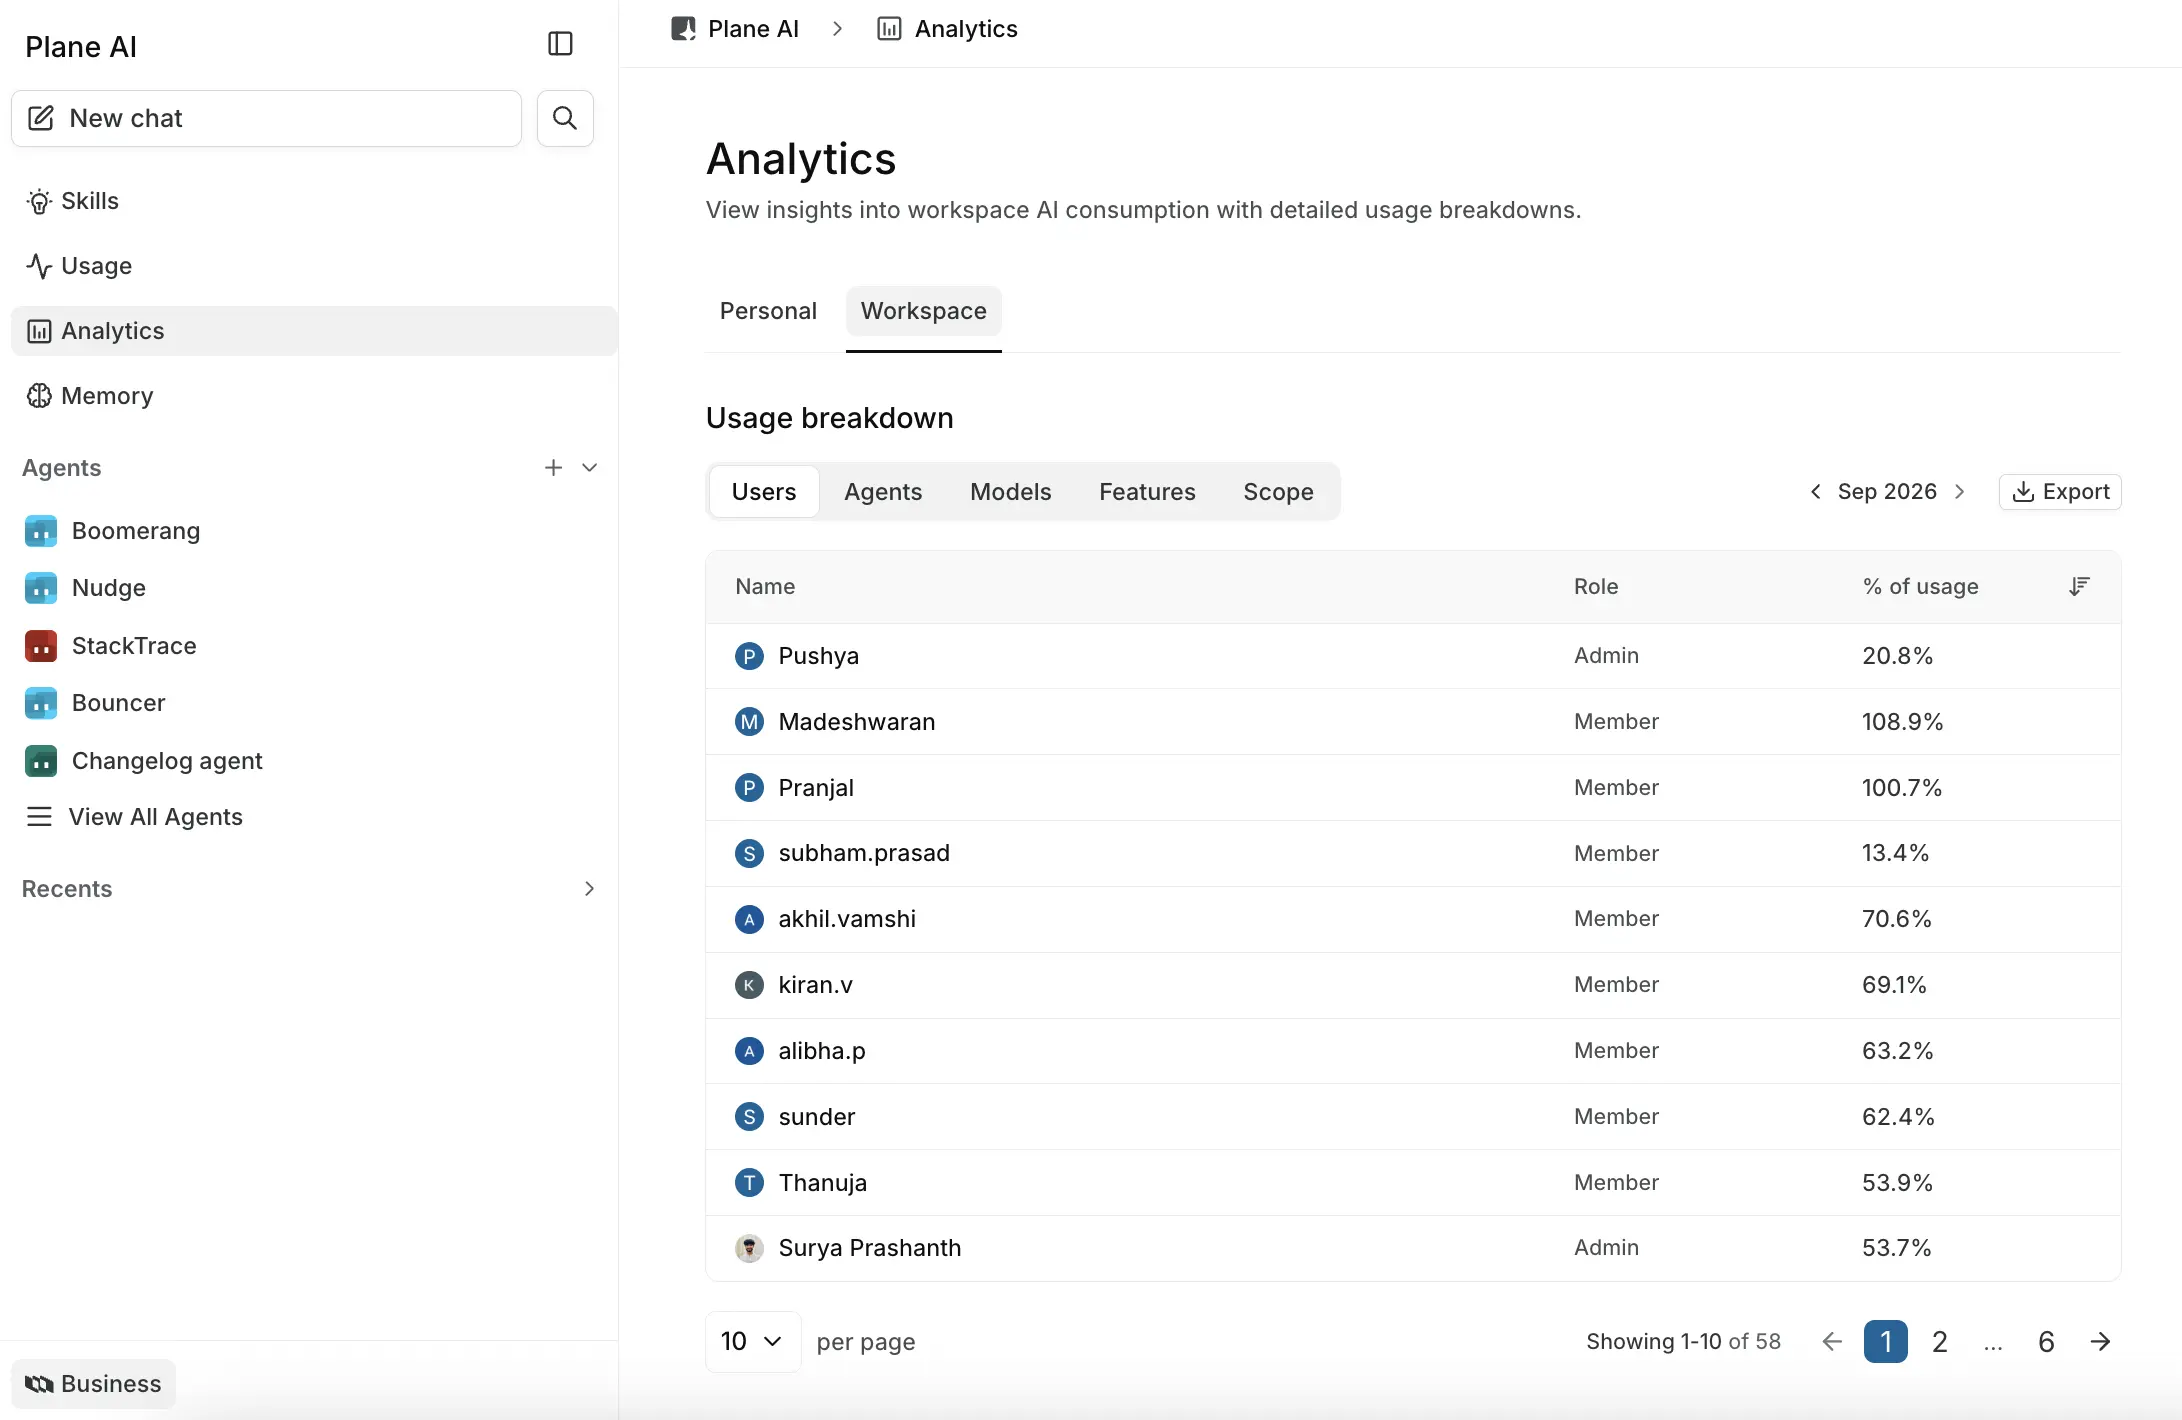
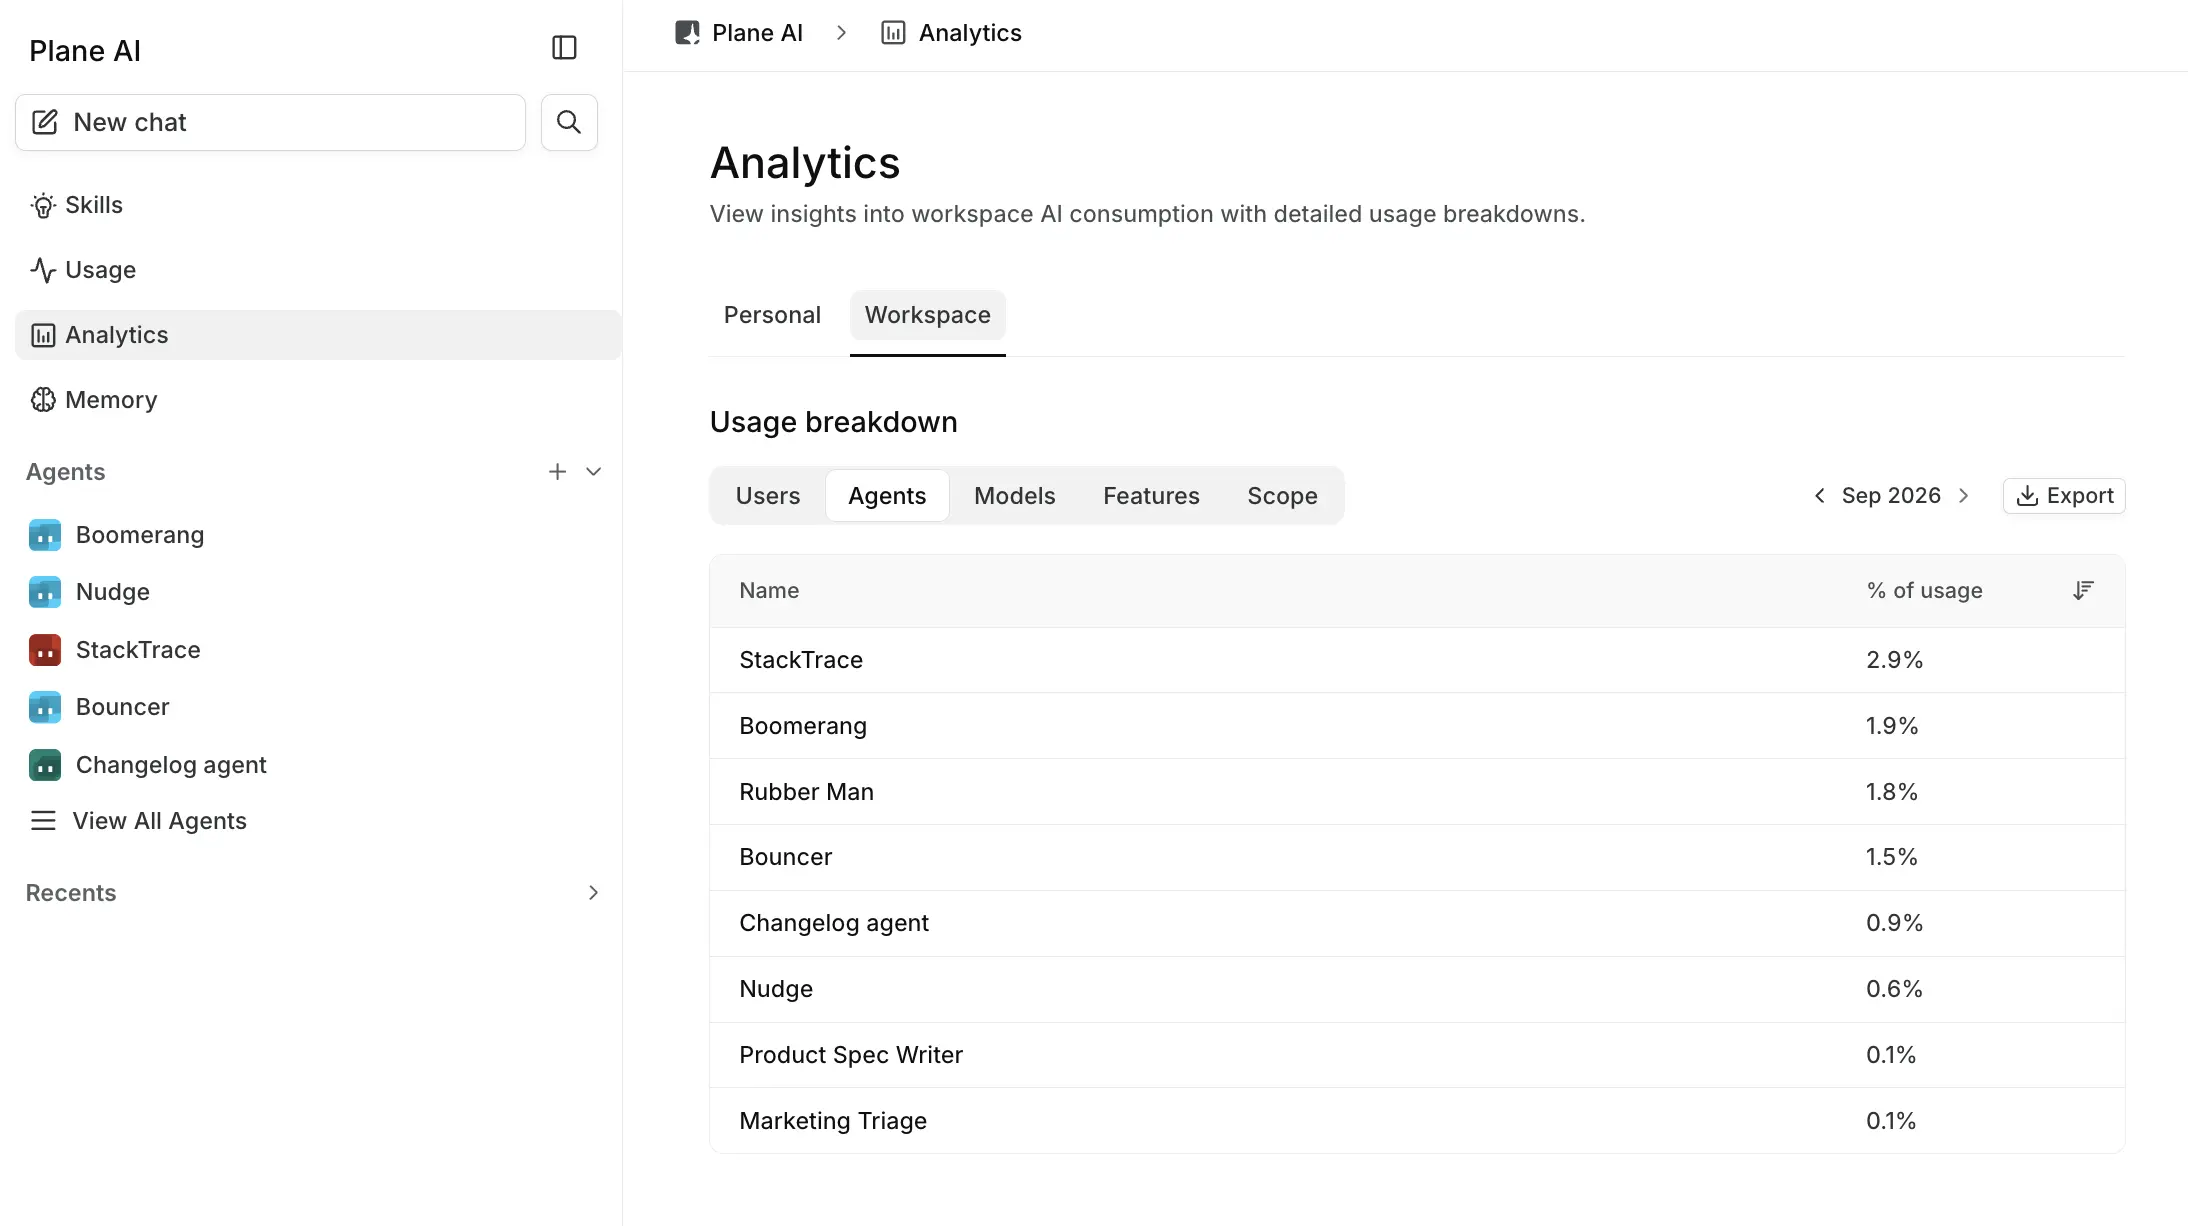
Usage breakdown groups the month's usage by one dimension at a time. Pick a tab, and use the arrows next to the month to look at earlier months.
| View | Tabs |
|---|---|
| Personal | Models, Features, Projects |
| Workspace | Users, Agents, Models, Features, Projects |
Agents appears only when agents are enabled in the workspace.
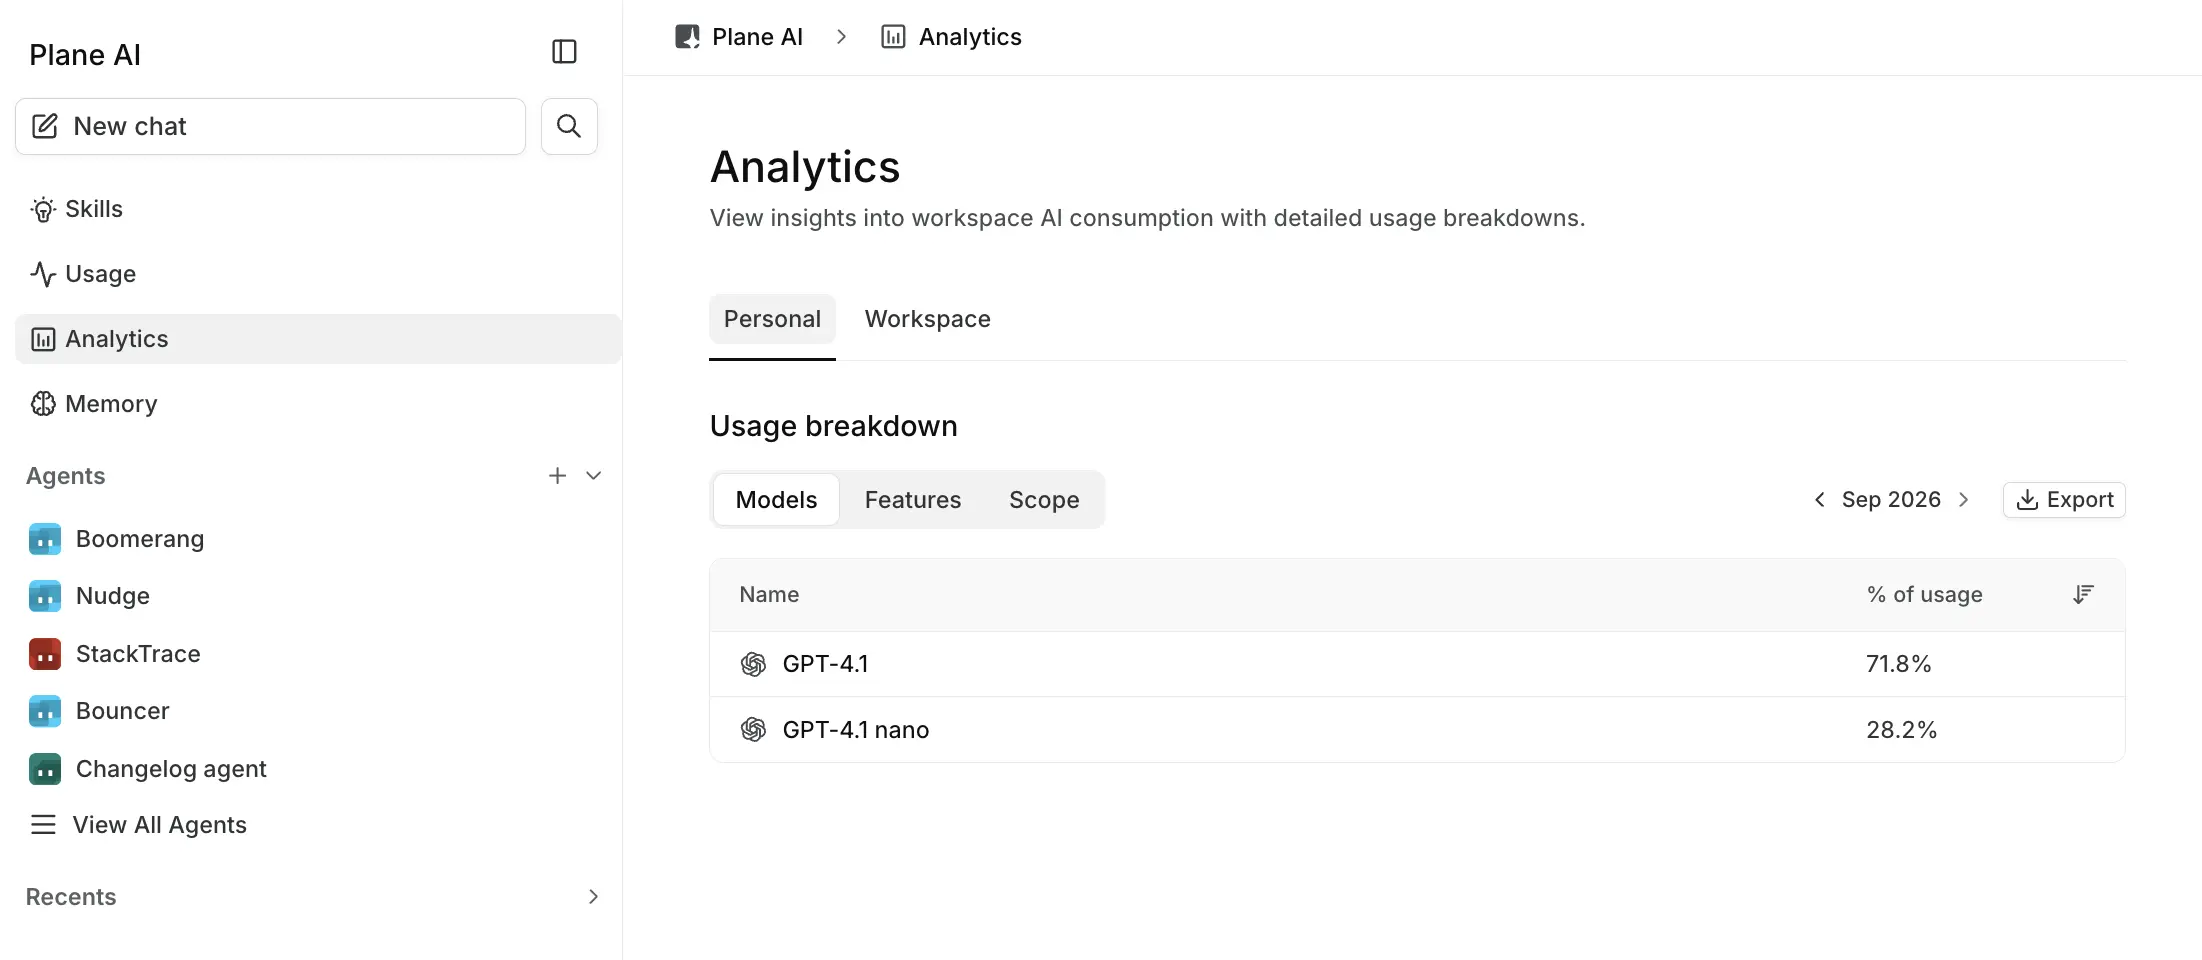
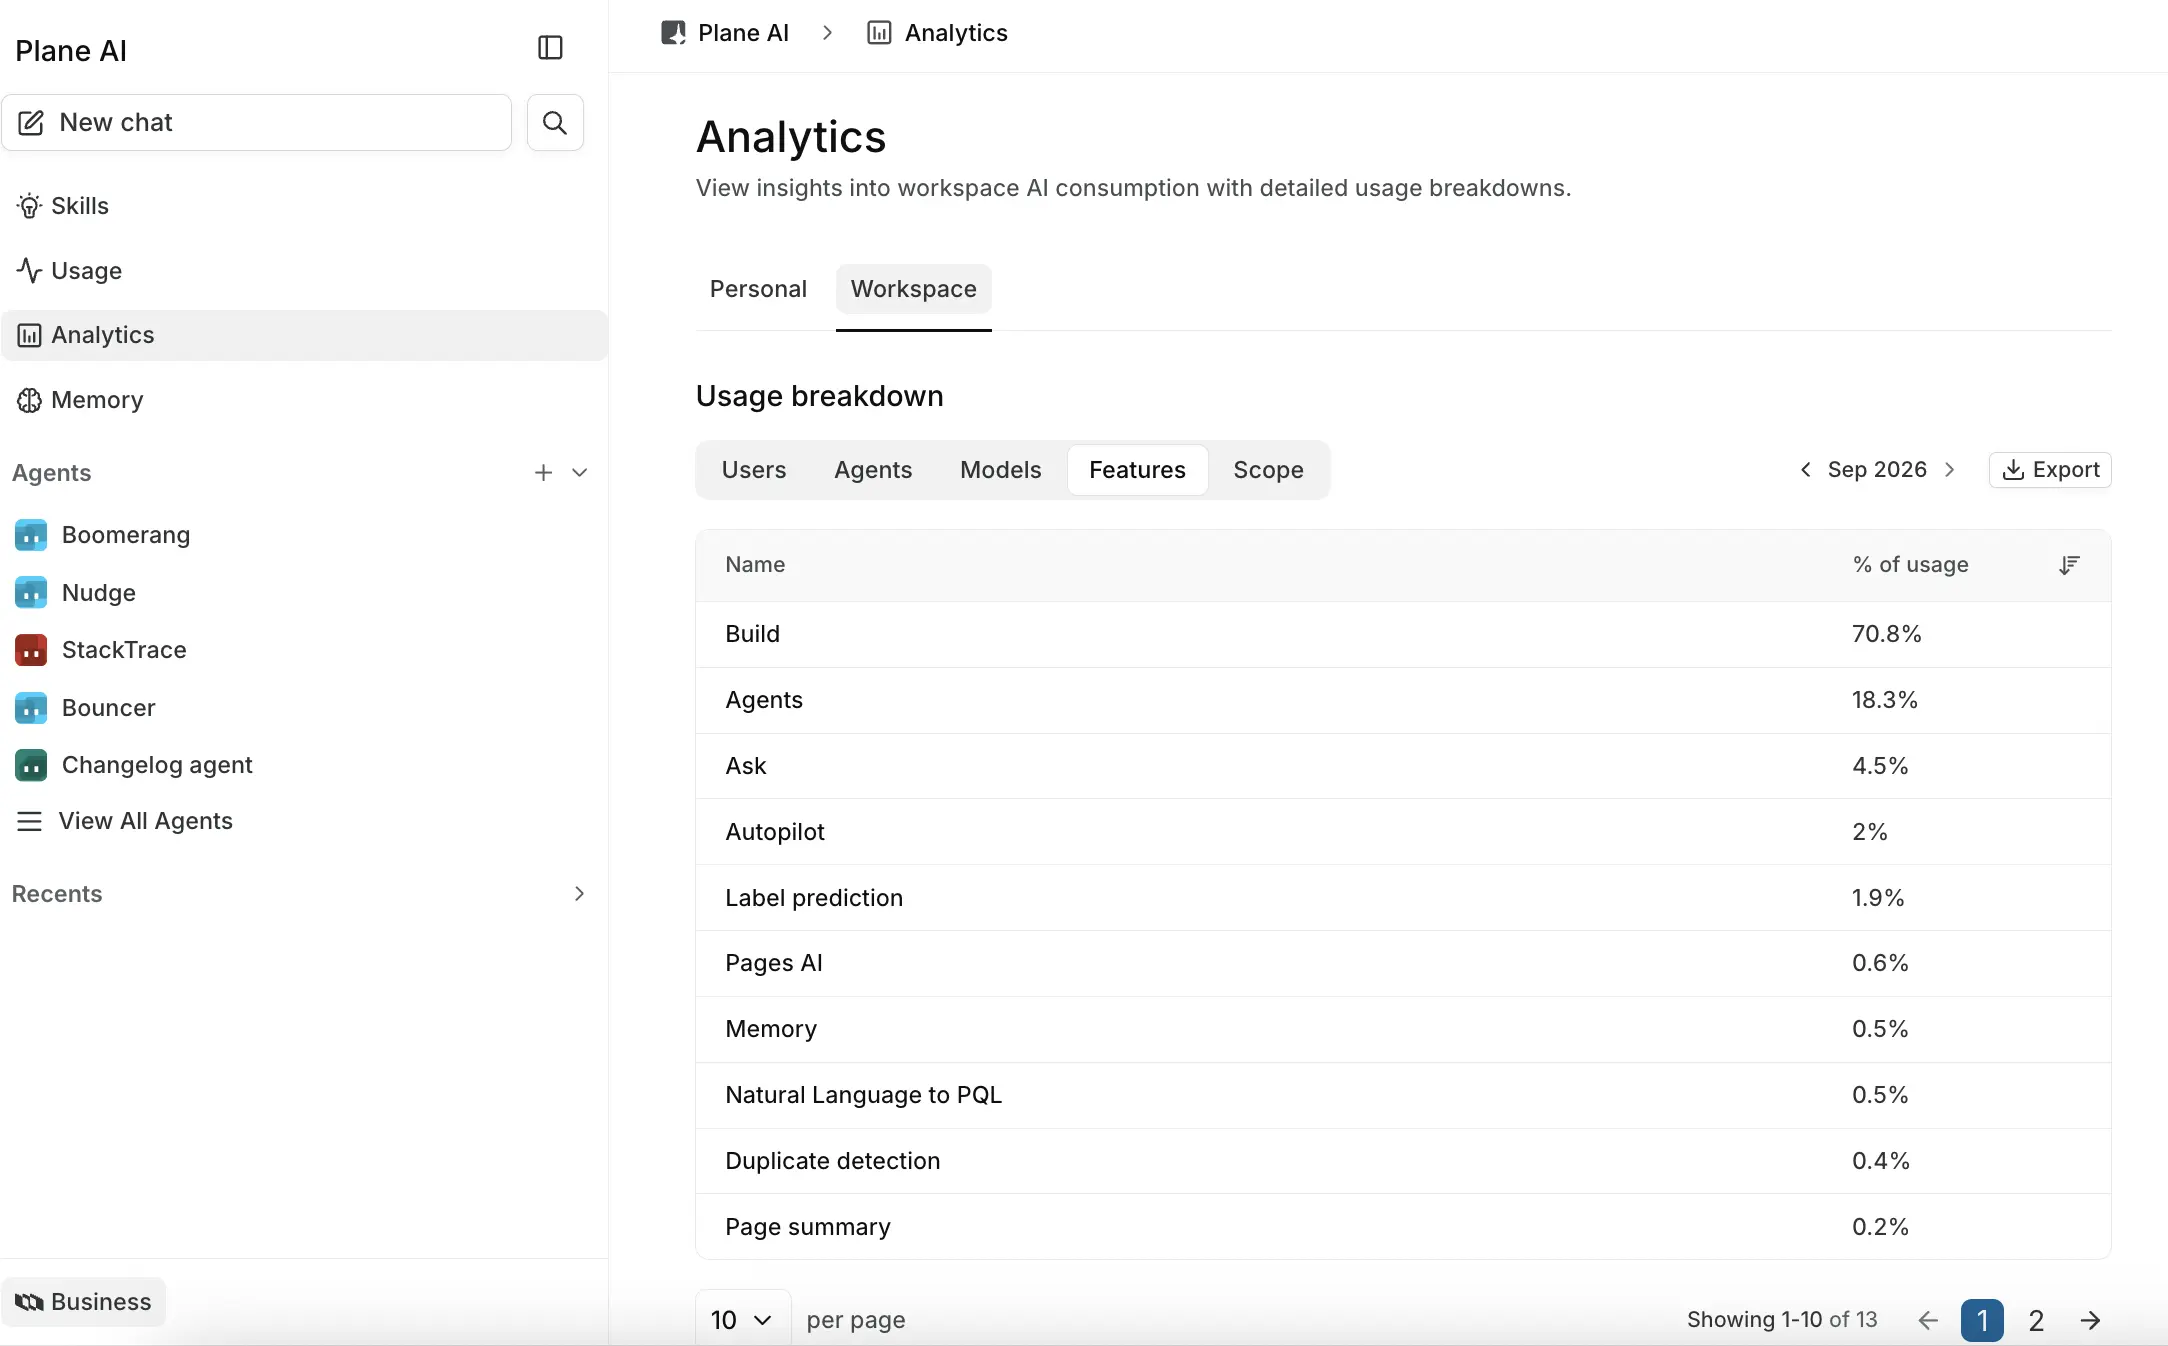
Each row shows a Name and its % of usage. The Users tab adds a Role column. The percentage is that row's share of the usage in the breakdown, not how much of an allowance it has used. Sort by the usage column, and page through the results when there are more than ten.
Features breakdown
Features tells you which parts of Plane AI your team uses most. Possible features include:
- Chat - Ask mode, Build mode, Autopilot
- Pages - Summaries, AI blocks, text rewrites
- Work items - Description generation and rewrites
- Queries - Plain language filtering (PQL)
- Duplicates - Duplicate work item detection
- Labels - Label suggestions
- Voice - Voice input
- Web search - Web search in chat
- Agents - Agent runs (all types: mentions, assignments, schedules, manual)
Export
Select Export to download the current breakdown as a CSV file. The file covers the selected month, view, and tab, with every row (not just one page at a time).
No usage data yet
The table shows No usage data yet when nothing has been recorded for the selected month, view, and tab. Check that you are looking at the right month.